
Nephi market notes · August–September 2026
What sold in Nephi? Here’s what the numbers say.
A closer look at 11 selected home sales from August 3 through September 24, 2026 — and what they can, and can’t, tell us about your home.
Nephi, Utah 5 min readBy Dana Hoyt · September 25, 2026
The short answer
Your neighbors sold. But not all for the same number.
If you picked up a flyer and wondered what a Nephi home is really selling for, this is the part worth reading. In this selected set of 11 closings, the average sold price was $476,600. The median — the sale right in the middle — was $460,000.
Those are useful starting points, not a price tag for your house. The homes in this set sold for anywhere from $289,000 to $750,000. That spread is the story: the right comparison depends on your home, not just your ZIP code.
The 11-sale snapshot
11
selected closings
$460K
median sold price
$476,600
average sold price
32
median days on market
Reporting window: August 1–September 25, 2026. The selected closings themselves occurred August 3–September 24. Source and selection notes appear below.
Around Nephi
Where the reported sales happened
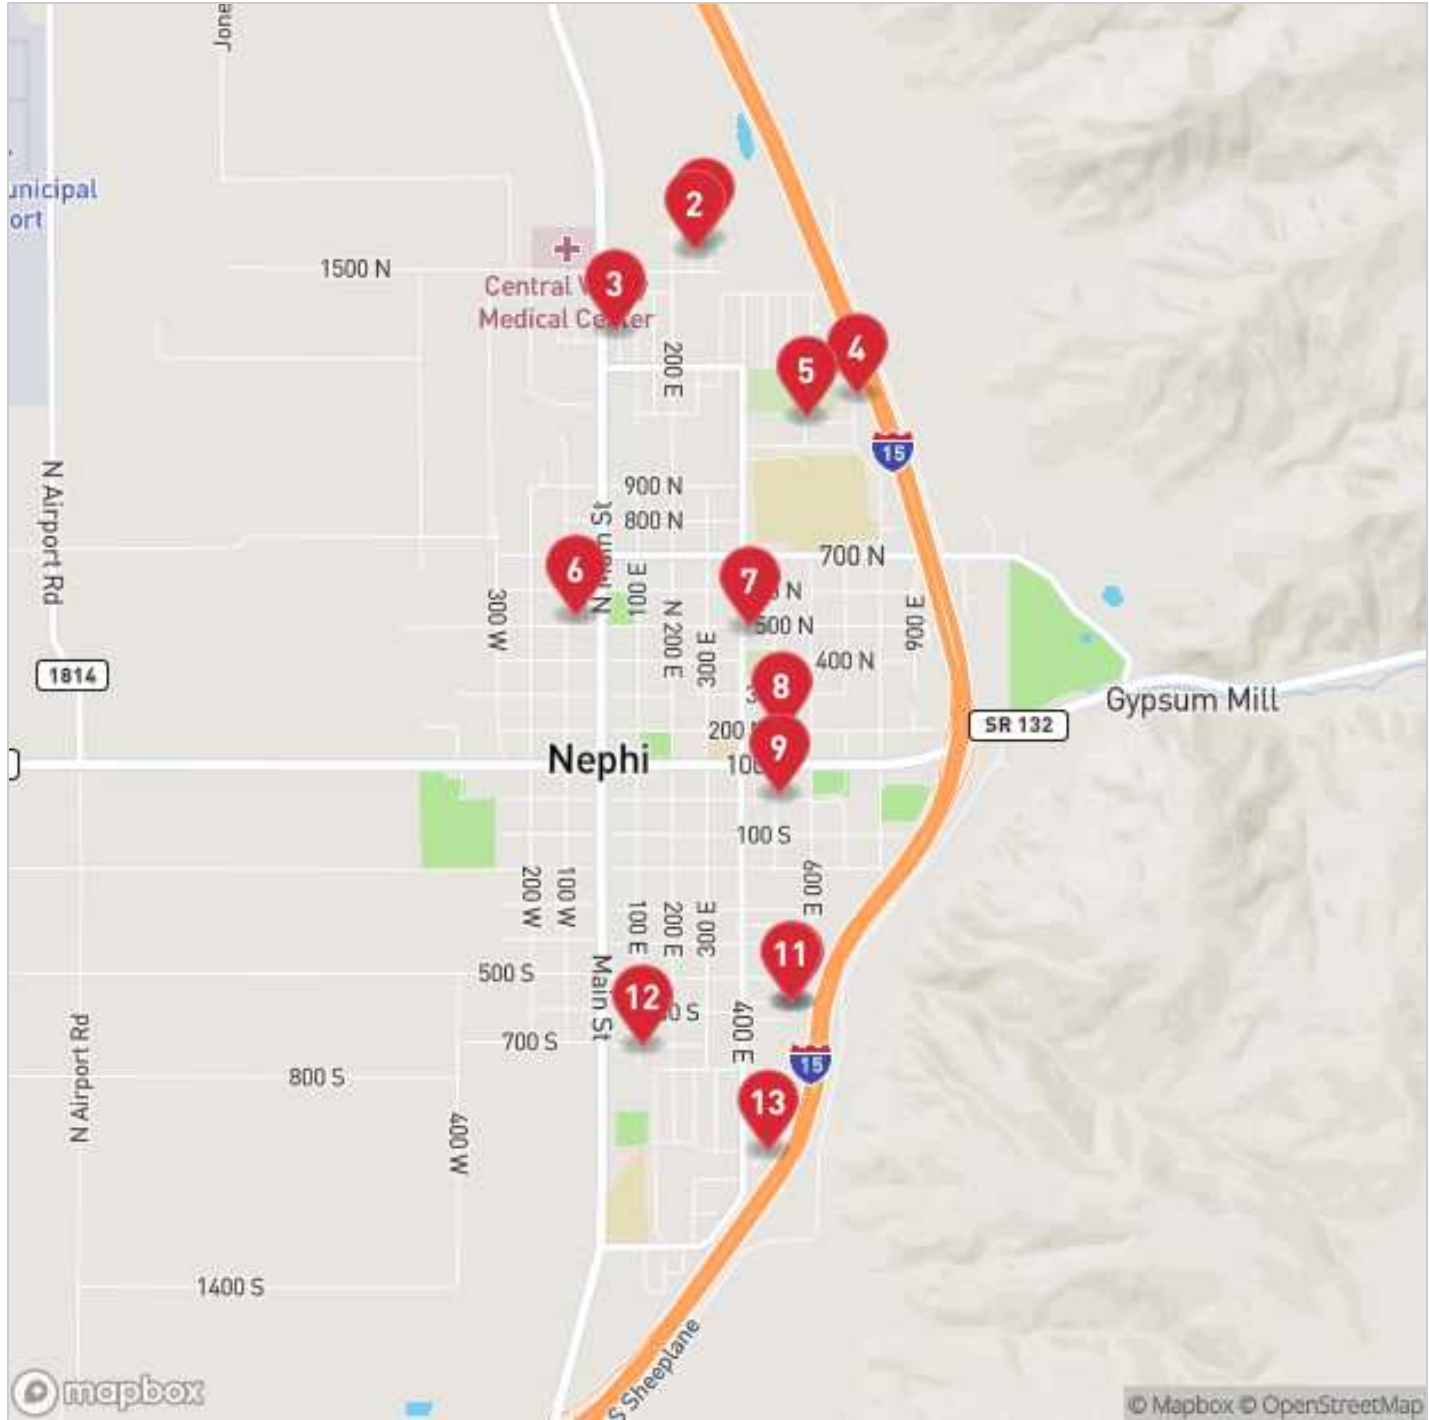
Here is the location map from the supplied UtahRealEstate.com report. The pins are spread across town, from the north end to the south end — another reason to compare a home with its closest peers, not with one citywide number.
Behind the average
A middle number doesn’t describe every home.
Picture two neighbors comparing notes over the fence. One has a larger home and a different lot; the other has a smaller place with a different layout or condition. Even if both sold this season, neither sale automatically sets the other’s value.
That’s why I look at the $460,000 median alongside the full $289,000–$750,000 range. The average was pulled by homes at both ends of that range. Sale prices worked out to about $184 per square foot on average in this selected group, but price per square foot is no substitute for looking at condition, layout, lot, updates and location.
11 selected closings, lowest to highest sold price · August 3–September 24, 2026. Pin numbers match the map above.
1,269 sq ft 4 bed 1 bath
1,519 sq ft 3 bed 1 bath
2,200 sq ft 2 bed 1 bath
2,200 sq ft 2 bed 1 bath
2,166 sq ft 4 bed 2 bath
2,451 sq ft 4 bed 2 bath
3,000 sq ft 3 bed 2 bath
2,811 sq ft 3 bed 2 bath
2,980 sq ft 3 bed 2 bath
4,323 sq ft 4 bed 2 bath
4,930 sq ft 7 bed 5 bath
Bar lengths compare sold prices within this selected set, with $750,000 as the longest bar. Sizes, bedrooms and bathrooms are reported figures, not a complete account of condition, lot or features. The $460,000 median is the sixth home shown here.
The question isn’t “What did Nephi sell for?” It’s “Which recent sales are actually like mine?”
Price and patience
What happened between asking and sold?
The average original asking price for these 11 homes was $488,618, compared with an average sold price of $476,600 — a difference of $12,018. That is a comparison of averages, not a claim that every seller took $12,018 less. Some sales came in at or above the original ask.
Time tells another part of the story. These homes averaged 50.5 days on market, while the median was 32 days. Five of the 11 sold after 30 days or fewer; those five averaged about 0.4% above their original asking prices. The other six, which spent more than 30 days on the market, averaged about 4.8% below their original asks.
Selected closings grouped by days on market · 11 total
Average sold price: 0.4% above original ask
Average sold price: 4.8% below original ask
The bar lengths show the share of the 11 sales, not the size of the price difference. This small snapshot does not show that extra days caused a lower price.
It would be tempting to say “wait longer, get less.” The data doesn’t prove that. Homes differ in price, presentation, size and circumstances, and this is a small selection. What it does suggest is that an honest starting price and a plan for the first few weeks matter.
If you live here
So what might your home be worth?
There isn’t an honest one-number answer from an eleven-home average. I’d start with the closest sold homes, then look at what makes yours different: square footage, usable lot, condition, improvements, floor plan and location. I’d also look at what buyers can choose from right now. A sale from last month tells us what happened then; it doesn’t guarantee a sale price today.
If you rent in Nephi and you’re curious whether owning here could make sense, these prices are a starting point for a budget conversation — not a monthly payment quote. Financing, taxes, insurance and cash to close change the picture.
Want a comparison that’s actually about your address?
Tell me a little about your home and I’ll help you sort through the closest sales, without treating a citywide average like an appraisal.
Ask Dana about your homeAbout these numbers
Source: UtahRealEstate.com report #4026889, prepared September 25, 2026; sold prices and square footage cross-checked against its map report. This article uses 11 matched residential closings selected from August 3–September 24, 2026, within an August 1–September 25 reporting window. It is not a count of every sale in Nephi or a live market report.
The 705 S 100 E closing was excluded from all figures because its reported $75,000 original list price is unusually low and should be verified before use. A sale appearing only in the supplied map report, without a matching detailed closing record, was also not included. Averages and percentages are rounded. Information is not guaranteed; buyers and sellers should verify relevant property details independently. No individual home value, future price movement or sale outcome is promised.
Share this post
Related posts
More on the local market

Market Update
More Homes Are Hitting the Market in Nephi, Utah — Is It Becoming a Buyer's Market?
Nephi homes are sitting a median of 86 days, with a median list price of $472,500 and a median sold price of $467,500. Here's what the shift means for buyers and sellers.
Read
Market Updates
Utah Housing Market Update — September 2026: Is It a Good Time to Buy?
The most-asked question in Utah real estate right now: can I actually afford to buy, and will prices drop? A plain-English look at prices, inventory, rates, and what September 2026 means for Utah County and Juab County buyers.
Read
Buying
You're Waiting for Rates to Drop — Here's What That's Quietly Costing You
Waiting for rates to drop before buying seems logical — until you factor in what happens to home prices when rates fall. Here's the honest math on waiting vs. buying now in Juab County, Utah.
Read